Protection against catastrophe has an awkward feature: its adequacy is clear only after the opportunity to prepare has passed. Wait for decisive evidence, and you may learn what you needed too late. Prepare successfully, and you may discover that you way over-prepared. When the stakes are catastrophic, the latter is clearly preferable. But how much so?
The Newsvendor model, already applied to disaster preparedness by Lodree and Taskin, helps explain why ex-ante overpreparation makes sense. Their approach weighs the cost of supplies that may go unused against the cost of shortages if disaster strikes. Human extinction requires a slightly different calculation. Economist Charles Jones’s model asks how much we should spend to reduce extinction risk. With a 10% pre-mitigation risk - motivated by warnings from frontier lab researchers - the model projects optimal AI safety spending of 22% to 40% of annual income for a decade across weak, middling, and strong assumptions about protection. At world-economy scale, that is $26 to $47 trillion a year.
Note: I used an LLM to help draft this post and it likely contains >10% AI-generated text, but I’ve edited/rewritten it and endorse it.
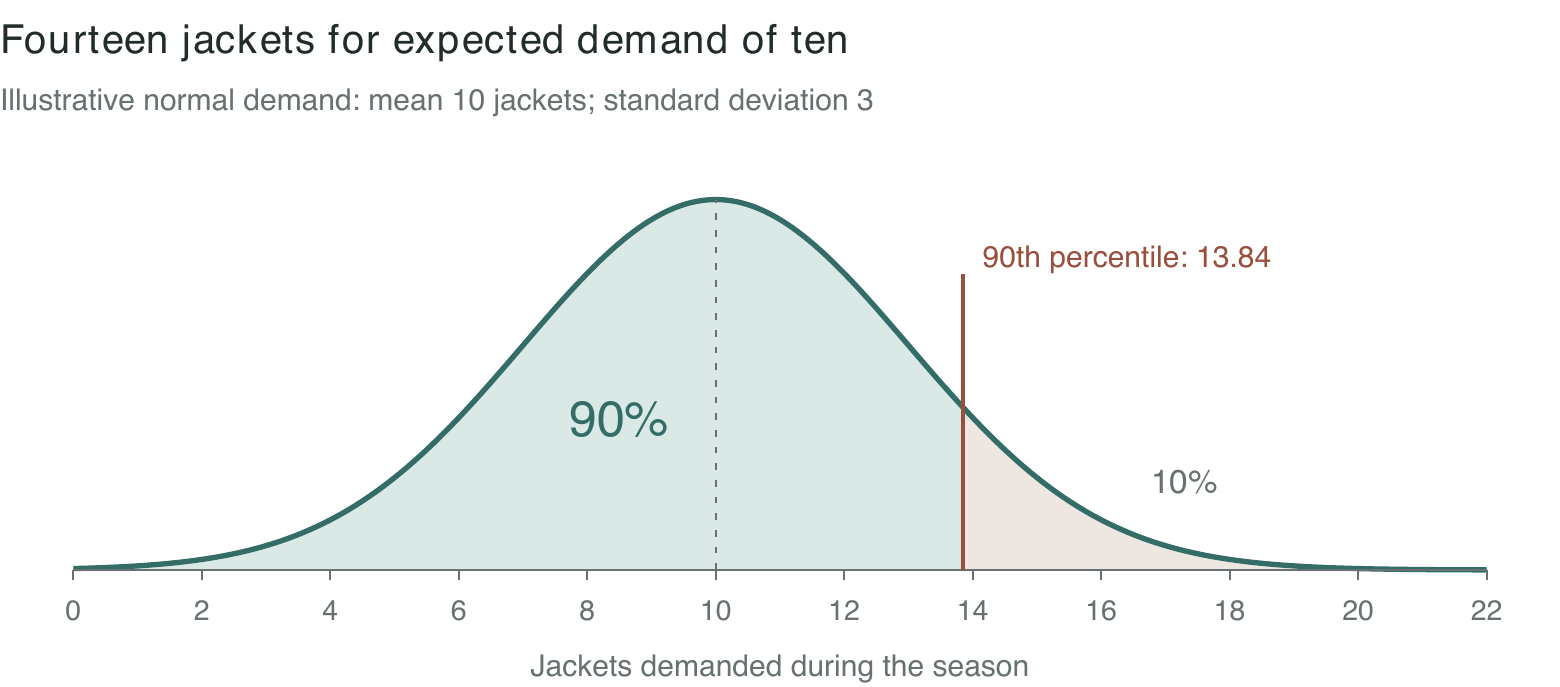
Suppose you run a jacket company and expect demand for ten jackets this winter. Manufacturing ten jackets seems sensible: produce what you expect people to buy.
But what if each jacket costs $10 to make and sells for $100? You cannot restock, and leftovers have no resale value. Make one too many and you lose $10, the overage cost. Make one too few and you miss $90 of profit, the underage cost. In other words, being one short costs nine times as much as having one leftover.
The Newsvendor model turns those costs into a target demand percentile:
Target percentile = Underage costUnderage cost + Overage cost = $90$90 + $10 = 90%
In this hypothetical, you’d want enough jackets to cover demand about 90% of the time. With normally distributed demand and a standard deviation of three jackets, that translates to 1.28 standard deviations above the mean:
10 + 1.28 × 3 ≈ 13.84 jackets
So, you’d manufacture fourteen jackets.
If demand comes in at ten, four jackets go unsold. That does not make the decision a mistake. You accepted a greater chance of leftovers because running short was more expensive. Hindsight tells you the outcome, not whether the original decision made sense.
Now imagine you’re stocking emergency supplies before hurricane season. You face two uncertainties: whether disaster will strike, and how much you’ll need if it does. Lodree and Taskin extend the Newsvendor model to account for both. Extra supplies may go unused, but preparing only for ordinary demand can leave you badly short when catastrophe hits. They interpret the additional inventory as a kind of insurance premium paid through preparation.
A simple way to express that logic is to weigh the costs under each scenario:
Expected cost(Q) = (1 − p) Cordinary(Q) + p Cdisaster(Q)
Here, Q is how much we stock, p is the probability of disaster, and each C includes the expected costs of buying supplies, holding leftovers, and running short in that scenario. We choose the quantity with the lowest combined expected cost. An unlikely disaster can justify extra inventory if the shortages would be expensive enough.
AI protection takes that argument one step further. Stocking supplies does not stop the hurricane; it helps us cope when one arrives. With AI, we also want investments that reduce the chance of catastrophe itself. We cannot simply equate the jacket’s $90 shortage cost with the extinction of humanity; moreover, extinction does not become ten times more costly because protection was ten times further short. It’s a binary outcome: we live or we die. The question becomes how much an investment changes the probability of avoiding that outcome.
That begs the question, what are the odds AI kills us all? If only the people at the frontier labs would tell us what they really think *touching fictional earpiece* wait, I’m being told some of them do!
On September 8, Jacob Coxon announced his resignation from Anthropic and criticized the leading labs' approach to the risks of superintelligence. Evan Hubinger, an Anthropic alignment researcher, cheerily replied: “we really do earnestly believe AI could kill all humans! I personally think it is >10% within the next decade.”
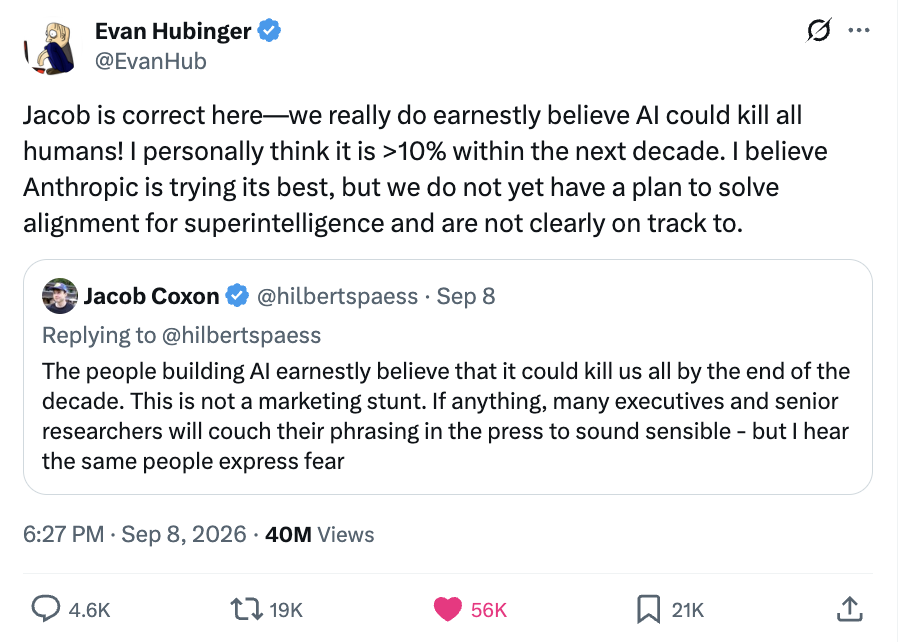
That is a personal forecast, not an official Anthropic estimate or a consensus. Its assumptions about future safety work are unstated. Still, if we take 10% seriously for a moment: what would we invest to bring it to 9%? To 1%?
The initial calculation is straightforward:
Expected catastrophe benefit = Δp × L
Here, Δp is the expected absolute reduction in catastrophe risk, including uncertainty about whether protection works; L is the value of avoiding catastrophe.
To decide how much to spend, we also need to account for what that spending costs us. Economist Charles Jones developed a model specifically for AI extinction risk, building on his earlier work on how much society should give up to prevent COVID deaths. As we commit more income, each additional dollar becomes harder to spare. The model looks for the point where further risk reduction no longer justifies the sacrifice.
Jones starts by valuing the remaining lives of everyone currently alive. He uses the ~$10 million statistical-life valuation used in U.S. policy analysis, which values small reductions in mortality risk. Applying it to extinction requires assumptions but gives us a starting point without having to value every future generation in perpetuity.
The next question is how much protection our money actually buys. In his model, Jones is upfront that nobody knows for sure. His model has two protection assumptions: how much of the risk is removable at all, and how effective spending is at removing it. Written out:
Remaining risk = Untouchable risk + Removable risk × (1 - effectiveness)years of GDP spent
where effectiveness is the share of the removable risk that one year’s GDP wipes out. Jones covers the full range, from none of the risk being removable to all of it and puts his baseline at the midpoint: half the risk is removable, and one year’s GDP removes half of that. In his words, his baseline “is not assuming a particularly powerful mitigation technology.”
Motivated by Hubinger’s warning, I assume a 10% extinction risk without mitigation.
$10 million per life, accounting for the ten-year delay and discounting, is about 120 years of income per person. Multiply that across the world economy and the value of avoiding extinction, the L from earlier, comes to roughly $14 quadrillion.
Against that, Jones’s baseline assumption - a 50% risk mitigation ceiling - puts 5% of risk in play. At those levels, the model recommends spending 39.5% of income for a decade - nearly four years of GDP in total - to lower the manageable risk from 5% to 0.3% and the total risk from 10% to 5.3%. Across the entire world, that is an optimal AI safety spend of ~$47 trillion per year.
This is the point at which the next dollar is no longer justified. By then each further point of income removes only a sliver of risk, and giving it up hurts nearly three times as much as the first point did. Benefit meets cost.
Of the two protection assumptions, mitigation effectiveness is more difficult to estimate, which is why Jones arbitrarily chooses 50%. However, it matters less than you’d think. Holding everything else at the base case and moving only that number, the model keeps spending unless a full year of world output would remove less than about 2% of the removable risk, and everywhere above that the answer stays between roughly $11 and $61 trillion a year.
| One year’s GDP removes… of the removable risk |
Annual income share spent for 10 years |
Annual spending each year for 10 years |
Remaining risk |
|---|---|---|---|
| 1.5% | 0% | $0 | 10.00% |
| 2% | 9.1% | $10.8T | 9.91% |
| 5% | 37.7% | $44.7T | 9.12% |
| 20% | 51.7% | $61.2T | 6.58% |
| 50% (Jones baseline) | 39.5% | $46.8T | 5.32% |
| 90% | 19.6% | $23.2T | 5.06% |
| 99% | 11.7% | $13.9T | 5.02% |
Given 10% starting risk, half of it removable, $10 million per life, world GDP of about $118 trillion. Only the effectiveness assumption changes. The model stops spending only if a year’s GDP would remove less than about 1.6% of the removable risk.
With that said, getting from 10% risk to 5% may be easier than getting from 1% to 0.5%, even though both halve the risk. The final few dangers are likely the hardest to address. Jones’s model includes diminishing returns, but using the same protection assumptions across different starting risks assumes the same proportional reduction takes the same spending.
The strength of protection also matters as much - if not more - than the amount we spend. Better protection options let us spend less and achieve more. To see how much protection strength matters, I tested two scenarios: “weaker protection options,” where only 25% of risk is removable and one year’s GDP removes 25% of that portion, and “stronger protection options,” where 90% of risk is removable and one year’s GDP removes 90% of that portion:
| Risk without mitigation |
Assumed protection |
Annual income share spent for 10 years |
Annual spending each year for 10 years |
Remaining risk |
|---|---|---|---|---|
| 10% | Weaker | 40.0% | $47.3T | 8.29% |
| 10% | Baseline | 39.5% | $46.8T | 5.32% |
| 10% | Stronger | 21.9% | $25.9T | 1.06% |
| 1% | Weaker | 0% | $0 | 1.00% |
| 1% | Baseline | 15.8% | $18.7T | 0.67% |
| 1% | Stronger | 12.8% | $15.2T | 0.15% |
| 0.1% | Baseline | 0% | $0 | 0.10% |
| 0.1% | Stronger | 3.7% | $4.4T | 0.05% |
Conditional model results, rounded. All cases use Jones’s ten-year period, utility curvature of 2, annual discount factor of 0.99, and current-generation valuation. All rows except the 1% baseline are new calculations. Dollar amounts apply each income share to 2025 world GDP of about $118 trillion; they are per year, not ten-year totals. Weaker: 25% of the risk is removable and one year’s GDP removes 25% of that. Baseline: 50% and 50%. Stronger: 90% and 90%.
From a 10% starting risk, the model justifies $26 to $47 trillion a year no matter which protection assumption you pick. What changes is what the money buys: roughly 1% remaining risk with strong protection, 5.3% with Jones’s midpoint, 8.3% with weak protection. Spending $47 trillion a year - as much as the baseline case - to move risk from 10% to 8.3% sounds absurd, and under this model it is still the rational choice, for the same reason the Newsvendor jacket manufacturer makes fourteen: when being short is extraordinarily expensive, a large premium for a small reduction is worth paying.
Where the results land in practice depends on how much of the danger protection can actually remove. That is the assumption Jones himself is least sure of. Better technology could take us below 5%, while disappointing results could leave us above it. At the extreme - if we assume the danger is very small and protection is insufficiently effective, the model may recommend no spending at all. This appears to be the current belief of most politicians.
The last assumption worth discussing is the value of a human life. Jones uses $10 million, the standard number in U.S. policy analysis. Applying this value of a human life globally extends a model calibrated to U.S. incomes.
Still, if $10 million feels high, consider the floor. In 1973, Ford wrote a memo weighing the cost of a fuel-system fix against the burn deaths it would prevent, valuing each death at $200,000. They concluded the fix was not worth it. When the memo leaked in 1977, after people had burned to death in rear-end Pinto crashes, it became a massive scandal, and $200,000 per life became a symbol of corporate callousness. Adjusted for inflation, that $200,000 would be $1.5 million today.
Run Jones’s model at $1.5 million per life from a 10% starting risk, and optimal spending is still 15% to 20% of income for a decade - $17 to $24 trillion a year - under the baseline and stronger protection assumptions. Even with weak protection, the model still spends 5.7% of income, about $7 trillion a year. It isn’t until protection can remove less than about 22% of the risk, 2.2 points of the 10%, that the model recommends spending nothing.
The case for investing substantially more on AI safety than we do today is compelling. For perspective, the Stanford AI Index reports about $345 billion in global private AI financing in 2025. If we earnestly believe there is a 10% chance of human extinction and that protection can meaningfully reduce it, we should be spending trillions per year on AI safety. But saying society should spend that money is easier than raising it or spending it well. Where should the money come from, who should receive it, and how do we know their work will reduce the risk?
Labs face pressure to ship and governments face pressure to “win the AI race” - incentives to put safety behind competitive advantage. The strongest protection is likely to come from independent organizations building toward safety with the same urgency that frontier labs bring to capability development.
For a lab, delaying a release means accepting an immediate commercial cost for a benefit shared by everyone. Pressure to deliver growth and satisfy investors can make that harder, especially as a company approaches an IPO. Governments framing AI as a race against rival countries face a similar problem. Armstrong, Bostrom, and Shulman model how competitors can gain an advantage by cutting precautions, pushing the whole race toward greater risk. Governments can still help by financing protection whose benefits extend beyond paying customers.
Venture investing offers a useful model: back different approaches, tolerate failures, and fund successful ones as they develop. Protection companies will need talent, resources, and ambition comparable to the labs they hope to keep pace with. They will also need evidence that their protection works and a way to capture its value, so investors keep funding their work.
Additionally, any company that develops better protection technology moves the protection assumption. Achieving the stronger protection case reduces remaining risk from 5.3% to about 1% while saving more than $20 trillion a year in optimal spending. The right protection shrinks the budget and buys more with it.
For any company pursuing AI safety, commercial ambition should be large. Reuters reported that Anthropic was preparing to describe an addressable market exceeding $30 trillion. Protection companies should think on a comparable scale: solving problems customers will pay for today while building toward the dangers that could emerge as AGI approaches.
The goal is to become protection that an expanding AI economy relies on - and to capture enough of that value to sustain the work. Much of the benefit of preventing catastrophe may never become revenue, but even a small share could support an exceptional business and give investors a reason to keep funding it.